 |
| Figure 1. Total UK energy consumption, 1998-2015 (Mtoe) (Source: Digest of UK Energy Statistics [DUKES], Department for Business, Energy and Industrial Strategy [BEIS], 2016) |
 |
| Figure 2. Global primary energy consumption by region, 1965-2015 (Mtoe) (Source: BP, 2016) |
 |
| Figure 3. World population by region, 1965-2015 (millions) (Source: BP, 2016) |
 |
| Figure 4. Global primary energy consumption per capita by region (toe) (Source: BP, 2016) |
As if the implications of present energy usage trends in the Asia Pacific region were not adequately stark, the situation in two other global regions also merits significant concern. The Africa and South and Central America regions between them host 22.74% of the global population, yet account for just 8.63% of global primary energy consumption. In the past decades, both have exhibited gradual increases in energy consumption which are moderate in comparison to that observed in the Asia Pacific region, but which are nonetheless substantial. In South and Central America, primary energy consumption increased from 108.29 Mtoe in 1965 to 699.26 Mtoe in 2015, an increase of 545.73%, while in Africa energy consumption increased from 59.74 Mtoe in 1965 to 435 Mtoe in 2015, an increase of 628.16. These increases far outstrip population growth in each region over the same period (142.44% in South and Central America, 268.5% in Africa), illustrating that the overwhelming cause of increasing energy consumption in both regions is increasing energy use per capita (an increase since 1965 of 166.22% in South and Central America and of 97.89% in Africa). The fact, however, that the population of Africa is projected to increase from around 1.186 billion today to 4.387 billion by 2100 (an increase of 269.81% - see Figure 5) can only serve to seriously exacerbate the already-increasing demand for energy in this region.
 |
| Figure 5. Projected world population by region, 2015-2100 (millions) (Source: Population Division, United Nations Department for Economic and Social Affairs, 2015) |
 |
| Figure 6. Global CO2 emissions by region, 1965-2013 (million tonnes of carbon) (Source: Carbon Dioxide Information Analysis Centre, 2016) |
Globally, between 1965 and 2013, global emissions of CO2 increased from 2121.36 million tonnes of carbon (Mtc) to 9136.01 Mtc, an increase of 330.61%. Striking as ever is the increase observed over the period in the Asia Pacific region, in which carbon emissions increased from 356.75 Mtc in 1965 to 4489.55 Mtc in 2013, a staggering increase of 1158.46%. The explosion in concentration of atmospheric carbon dioxide which this increase in emissions has caused has unavoidable consequences for global climate. Throughout the past century and a half, mean global temperature has steadily yet significantly increased, accelerating throughout the latter half of the 20th century and into the first two decades of the 21st century, as illustrated by Figure 7.
 |
| Figure 7. Global temperature anomaly, 1880-2015 (C) (anomaly from 1951-1980 mean) (Source: NASA, 2016) |
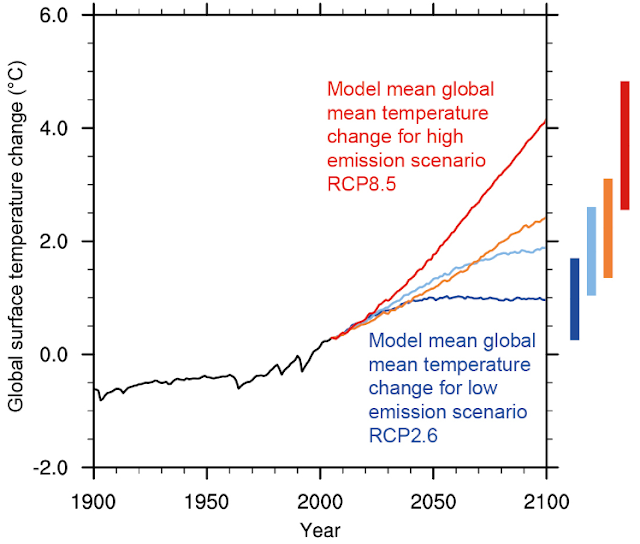
With continued and increasing emissions of GHGs, global temperatures are projected to increase yet further (and at a more alarming rate) into the next century. Figure 8 shows the Intergovernmental Panel on Climate Change (IPCC) projection for global temperature increase over the course of the 21st century.
 |
| Figure 8. Projected global surface temperature change (relative to 1986-2005 mean), 1900-2100, under four IPCC emissions pathways (Source: United States Environmental Protection Agency, 2016) |
As Figure 8 shows, unless dramatic measures are taken to reduce global emissions of GHGs, unprecedented changes in global temperature will occur during the 21st century. If I have somewhat bombarded the reader with figures and percentages over the course of this first blog post, it is only an attempt to forcefully illustrate the massive scale of unavoidable future increases in global energy consumption. Given that even present levels of resource consumption and GHG emissions are dangerously unsustainable (IPCC, 2016), it is of the utmost urgency that a global shift is undertaken in global energy production from fossil fuel-based methods to methods which do not cause emissions of GHGs. Given substantial projected increases in global population, and rapidly increasing energy use per capita in industrialising or newly-industrialised regions, these methods must also offer sufficient generating capacity to massively increase global energy production over the coming century. Substantial increases in energy production are vital especially in the context of industrialising and newly-industrialised countries, in which economic development and improved social wellbeing are urgent priorities (Jeffs, 2012). This blog will seek to examine the various means of sustainable energy production on offer, and to evaluate the practicality and implications of each as a replacement for present fossil fuel-based means of energy production.
References
BP (2016), Energy Charting Tool (tools.bp.com/energy-charting-tool; 27/10/2016)
Carbon Dioxide Information Analysis Centre (2013), Carbon Emission Time Series Regional Data (http://cdiac.ornl.gov/CO2_Emission/timeseries/regional; 27/10/2016)
Department of Business, Energy and Industrial Strategy (BEIS) (2016), Digest of UK Energy Statistics [DUKES]
Intergovernmental Panel on Climate Change (2014), Climate Change 2014: Synthesis Report; contribution of Working Groups I, II & III to the Fifth Assessment Report of the Intergovernmental Panel on Climate Change (core writing team: R.K. Pachauri & L.A. Meyer (eds.)) Geneva: IPCC (151 pps.)
Jeffs (2012), Greener Energy Systems: Energy Production Technologies with Minimum Environmental Impact, Boca Raton: CRC
NASA (2016), Global Climate Change: Vital Signs of the Planet (http://climate.nasa.gov/vital-signs/global-temperature; 27/10/2016)
Population Division, United Nations Department of Economic and Social Affairs (2015), World Population Prospects, the 2015 Revision (https://esa.un.org/unpd/wpp; 27/10/2016)
United States Environmental Protection Agency (2016), Future of Climate Change (https://www.epa.gov/climate-change-science/future-climate-change; 27/10/2016)
No comments:
Post a Comment